
☰ Course contents
Mathematics 🔬 Grade 12 Null World: Hypothesis Testing and the p-Value
🔬 Grade 12 · Lesson 13 of 13

Null World: Hypothesis Testing and the p-Value

Imagine a world where nothing is really going on. If your result would be a shock even there, that is your evidence something is.
Grade 12Calculus / AP level
Null World: Hypothesis Testing and the p-Value — illustration
💡
The big idea: Hypothesis testing asks one disciplined question: could plain chance have produced my result? You build a <strong>null world</strong> where nothing is happening, work out how results scatter by luck alone (the null distribution), and check where your actual result falls. If it lands far out in the tail &mdash; something that would rarely happen by chance &mdash; that surprise, measured as the <strong>p-value</strong>, is your evidence against the null.
🎯 By the end, you'll be able to
  • State a null and alternative hypothesis for a simple claim
  • Describe the null distribution as the spread of results expected under pure chance
  • Define the p-value and interpret it correctly (and avoid the common misreading)
  • Compare a p-value to a significance level &alpha; to decide whether to reject the null
📎 You should already know
  • The normal distribution and z-scores
  • Basic probability

The skeptic's world

A new coin looks like it lands heads too often. A tweak to a website seems to lift sales. How do you tell a real effect from a lucky streak? Statistics answers with a deliberately skeptical move: first assume there is no effect at all.

That skeptical assumption is the null hypothesis (H₀) — the claim that nothing is going on, that any difference you see is just chance. Its rival, the alternative hypothesis (H₁), says a real effect exists.

🔑 Build the world where nothing happens
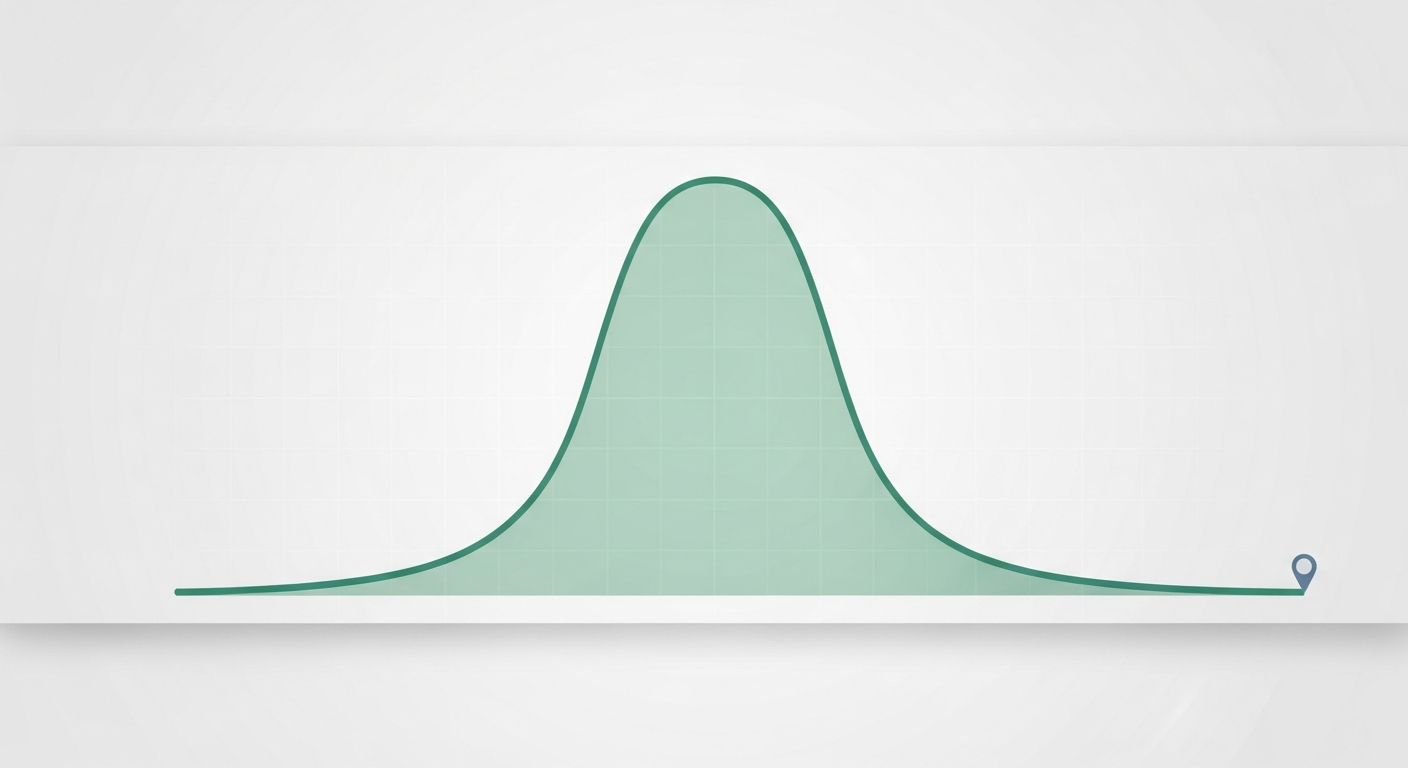
The heart of the method is the null distribution: if H₀ were true and only chance were at work, how would your result scatter across many repeats? This gives you a full picture of what “normal luck” looks like — the yardstick you measure your actual result against.
\[ H_0:\ \text{no effect (only chance)} \qquad H_1:\ \text{a real effect exists} \]
Every test pits a skeptical null against an alternative. You never prove H&#8320;; you only decide whether the data give enough reason to abandon it.
🎮 Null World LIVE
Simulate a world where nothing is going on, and see how surprising your observed result would be.

Measuring the surprise

Now overlay your real result on the null distribution. If it sits comfortably in the fat middle, chance explains it easily. If it sits way out in a thin tail, it is the kind of result that would rarely happen by luck alone.

The p-value puts a number on that surprise: it is the probability, assuming the null is true, of getting a result at least as extreme as the one you observed.

✨ Small p-value = big surprise
A small p-value (say 0.01) means “in the null world, a result this extreme would show up only about 1% of the time” — strong evidence that the null world is the wrong model. A large p-value (say 0.4) means the result is unremarkable under chance, so there is no reason to abandon the null.
\[ p\text{-value} = P(\text{result at least as extreme} \mid H_0 \text{ true}) \]
The p-value is computed inside the null world &mdash; it assumes H&#8320; and asks how often chance alone would match or beat your result.

Drawing a line: the significance level

To turn the p-value into a decision, fix a threshold in advance called the significance level α — commonly 0.05. If p < α, the result is too surprising to blame on chance, and you reject the null. If p ≥ α, you fail to reject it — the evidence simply is not strong enough.

📝 Worked example: A coin is flipped 100 times and lands heads 60 times. Under H&#8320; (a fair coin), is this surprising? Use &alpha; = 0.05.
  1. Null world: a fair coin gives on average 50 heads, with standard deviation \( \sqrt{100\cdot 0.5\cdot 0.5} = 5 \).
  2. Locate the result: \( z = \dfrac{60 - 50}{5} = 2 \), so 60 heads is 2 standard deviations above expectation.
  3. A result 2σ or more from the mean happens only about 5% of the time by chance — here the two-sided p-value is about 0.046.
  4. Compare to α: 0.046 < 0.05.
✓ Since p &asymp; 0.046 &lt; 0.05, we <strong>reject H&#8320;</strong> &mdash; the data give evidence the coin is not fair.
⚠️ What the p-value is NOT
The p-value is not the probability that the null hypothesis is true, and (1 − p) is not the probability the alternative is true. The p-value is computed assuming H₀ holds — it measures how well the data fit the null world, not the odds that the null world is real. Also, “fail to reject H₀” is not the same as “prove H₀”; absence of strong evidence is not evidence of absence.

Check your understanding

1. What does the null hypothesis H&#8320; typically claim?
The null is the skeptical baseline: nothing is going on, and any observed difference is due to random chance alone.
2. The p-value is the probability of…
By definition the p-value is P(result at least as extreme | H₀ true) — it is computed inside the null world.
3. Using a significance level &alpha; = 0.05, you get a p-value of 0.02. What do you do?
Since p = 0.02 < α = 0.05, the result is too surprising for chance alone, so you reject the null hypothesis.
4. Which statement about a p-value of 0.03 is CORRECT?
The p-value assumes H₀ is true and measures how often chance would produce such an extreme result — about 3% here. It is not the probability that H₀ is true.
5. A Type I error in hypothesis testing is…
A Type I error is a false positive: rejecting H₀ when it is in fact true. Its probability equals the significance level α.
✅ Key takeaways
  • Hypothesis testing starts by assuming the null hypothesis H&#8320;: nothing is going on but chance.
  • The null distribution shows how results scatter by luck alone if H&#8320; were true.
  • The p-value is the probability, assuming H&#8320;, of a result at least as extreme as the one observed.
  • Compare the p-value to a preset significance level &alpha;: reject H&#8320; when p < &alpha;, otherwise fail to reject.
  • A p-value is not the probability that H&#8320; is true, and failing to reject H&#8320; does not prove it.