
ABC Classification
Ranking stock by value so attention follows the money
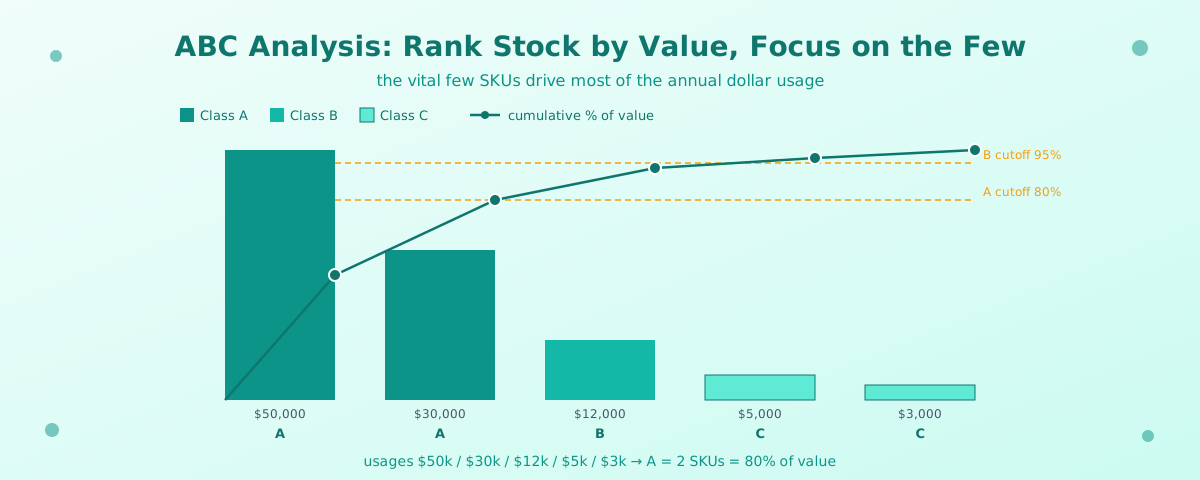
A warehouse can hold thousands of SKUs. Managing every one with equal effort wastes time on items that barely matter. ABC classification ranks stock by how much value it drives, so effort follows the money.
Value first, not SKU count
A buyer who treats 5,000 SKUs identically spreads attention thin. ABC classification applies the Pareto principle to stock: rank every SKU by its annual dollar usage -- annual demand multiplied by unit cost -- and the cumulative share of total value tells you where the money really sits. A small fraction of SKUs usually accounts for most of the value, so the ranking tells you which items deserve tight control and which can be left on autopilot.
Reading the formula
Take five SKUs with annual dollar usages of $50,000, $30,000, $12,000, $5,000, and $3,000. Total value = 50,000 + 30,000 + 12,000 + 5,000 + 3,000 = $100,000. Sort from largest to smallest and track the running share: the top SKU is 50,000 / 100,000 = 0.50 of value; the top two reach 80,000 / 100,000 = 0.80; the top three reach 0.92; the top four 0.97; all five 1.00. With Class A drawn at a cumulative share of 0.80 and Class B at 0.95, two SKUs are Class A (80% of value), one is Class B (cumulative 0.92), and two are Class C (0.97 and 1.00).
The standard split puts Class A at a cumulative value share at or below 0.80 and Class B at or below 0.95; the rest are Class C. The payoff is focus: tight controls, frequent counts, and careful forecasting for the few Class A items that drive most of the value; light, automated handling for the long Class C tail. The exact thresholds are conventions -- 0.80 and 0.95 are common, not laws -- chosen to fit how lumpy the value distribution actually is.
- 1. Total value = 50,000 + 30,000 + 12,000 + 5,000 + 3,000 = $100,000.
- 2. Sorted cumulative shares: 0.50, 0.80, 0.92, 0.97, 1.00.
- 3. Class A (cumulative share at or below 0.80): two SKUs, holding 80,000 / 100,000 = 0.80 of value. Class B (to 0.95): one SKU (0.92). Class C: two SKUs (0.97, 1.00).
💡 Hint
- 1. Total value = 45,000 + 25,000 + 18,000 + 8,000 + 4,000 = $100,000.
- 2. Sorted cumulative shares: 0.45, 0.70, 0.88, 0.96, 1.00.
- 3. Class A (cumulative share at or below 0.80): two SKUs (0.45, 0.70), holding 70,000 / 100,000 = 0.70 = 70% of value.
Check your understanding
- ABC classification ranks SKUs by annual dollar usage (annual demand x unit cost) and tracks the cumulative share of total value.
- Class A is the top ~80% of value, Class B runs to ~95%, and Class C is the rest.
- Effort should follow value: tight control for the vital few Class A items, light handling for the Class C tail.