
Data Types & Levels of Measurement
Structuring Data for Analysis
Structured vs. Unstructured Data
Data comes in many forms. Structured data is highly organized, typically fitting neatly into rows and columns like a spreadsheet. Examples include sales figures, customer ages, and product prices. This type of data is easy to search, sort, and analyze using standard tools.
Unstructured data lacks a predefined format. Examples include customer reviews, social media posts, and video files. While rich in information, analyzing unstructured data requires specialized techniques like text mining before it can be used in standard business analysis.
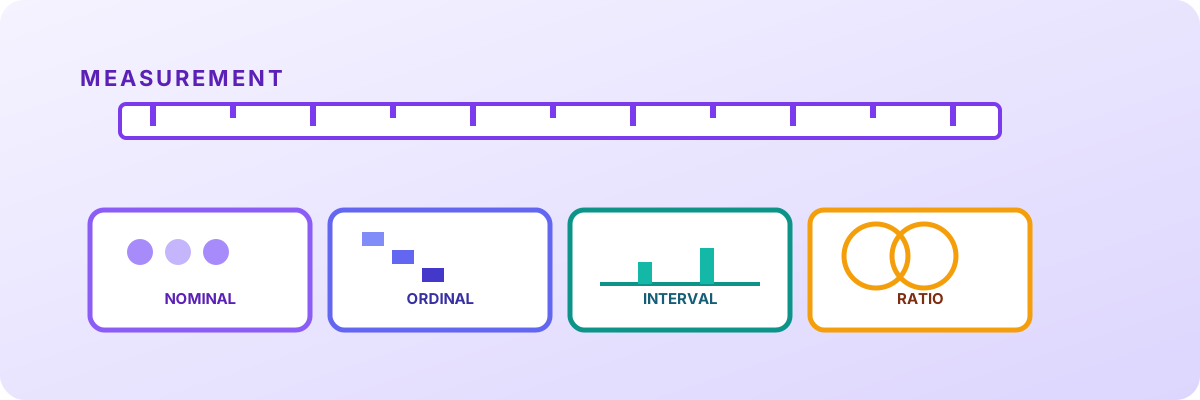
The level of measurement determines what you can do with the data. The four levels are: Nominal (categories with no order), Ordinal (ordered categories), Interval (ordered with equal spacing, no true zero), and Ratio (ordered, equal spacing, with a true zero).
Nominal and Ordinal Data
Nominal data represents categories with no intrinsic order. Examples include payment methods (Credit Card, PayPal, Cash) or product colors. You can count frequencies or find the mode, but you cannot calculate a meaningful average.
Ordinal data has a meaningful order, but the distance between categories is not uniform. A customer satisfaction survey (Poor, Fair, Good, Excellent) is ordinal. You can find the median or mode, but calculating a mean is mathematically inappropriate because the difference between 'Poor' and 'Fair' is not necessarily the same as between 'Good' and 'Excellent'.
Interval and Ratio Data
Interval data has ordered values with equal distances between them, but no true zero point. Temperature in Celsius is an example; 0 degrees C does not mean 'no temperature'. You can calculate mean, median, and mode, but ratios like 'twice as hot' are meaningless.
Ratio data has all the properties of interval data, plus a true zero point. A value of zero means the complete absence of the quantity. Examples include revenue, distance, and time. Because of the true zero, you can compute meaningful ratios (e.g., $100 is twice as much as $50) and all mathematical operations, including the mean, are valid.
Averaging nominal category codes (e.g., assigning 1=Credit, 2=PayPal and averaging to 1.5) is meaningless. Always check the level of measurement before applying formulas.
Population vs. Sample
Finally, consider whether your data represents a population or a sample. A population includes every member of a group you want to study (e.g., all employees in a company). A sample is a subset of the population. Most business analysis relies on samples because collecting data on the entire population is often too expensive or impossible.
- Sum the order values: 20 + 35 + 25 + 40 + 30 = 150.
- Count the number of orders: 5.
- Divide the sum by the count: 150 / 5 = 30.
- The mean order value is $30. This is valid because order value is ratio data.
- Averaging payment method is meaningless because 'payment method' is nominal data; codes like 1 and 2 are labels, not quantities, so their mean has no interpretation.
This lesson explains foundational data concepts for educational purposes only and does not provide guidance on specific database technologies or professional data management practices.
Check your understanding
- Data is structured or unstructured, and measured at one of four levels: nominal, ordinal, interval, or ratio.
- The measurement level decides which summaries are valid - you can average ratio data but not nominal category codes.
- A mean is meaningful for ratio values (five orders averaging $30) but meaningless for a coded 'payment method'.
- Know whether you hold a full population or a representative sample before you generalise.